- Home

- Blog
- Stuart Alexander
- Get a better view of your farm
Get a better view of your farm

Using satellites to get a different perspective of your farm really can open up a wealth of opportunities.
Of course, we all know that satellite imagery isn't a new thing – people have been using it to take images of crops since 1995. However, the accuracy, resolution, frequency and our overall understanding of the technology has drastically improved, making it a valuable tool on farm.
Using satellite imagery to record crop differences
While satellites show us an incredible amount of visual information when it comes to crop analysis, they don't tell us what it causing the difference or variation that we see.In the same way that an emissions test on a car MOT measures grams of pollutant, it only flags the problem rather than explaining what is wrong.
The satellite imagery used in MySOYL utilises Normalised Difference Vegetive Index (NDVI), alternatively referred to as biomass. The satellite uses near-infrared (NIR) and infra-red (IR) and it's this which gives us the biomass reading. Rather than looking at the crop with a 'camera lens' and showing us what we already see, the NIR and IR takes the primary colours red, green and blue and adds a value to them. For example, healthy crops absorb more blue-light and red-light energy to fuel photosynthesis and create chlorophyll. A plant with more chlorophyll reflects more infrared energy than an unhealthy plant.
Now that the science has been explained...
...We can move onto the ways that MySOYL uses satellite imagery to benefit growers on farm.
As it happens, biomass imagery can be used all through the year and there isn't a single image that can't tell you something. I often think that, if we compared it to a machine on the farm, it's like a teleporter: it's used by many people, there aren't many days it isn't used and once you've got it, it has endless uses that you can later rely on.
For example, below are some instances where satellite imagery has been used on farm this year:
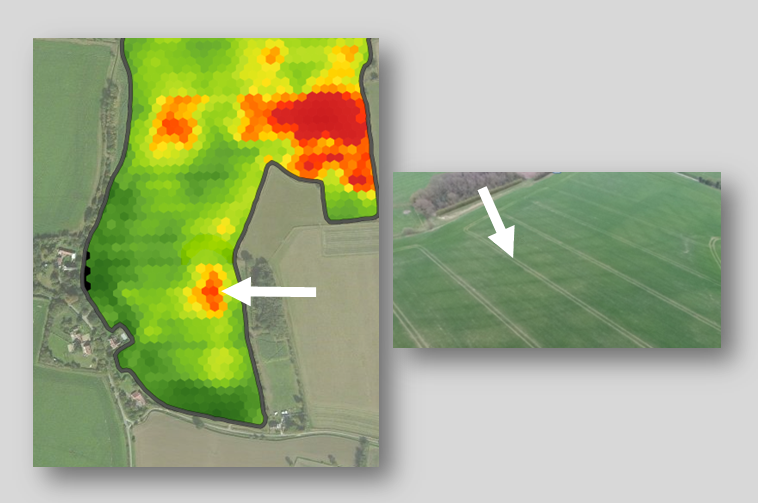
- The management of cabbage stem flea beetle (and other pests)
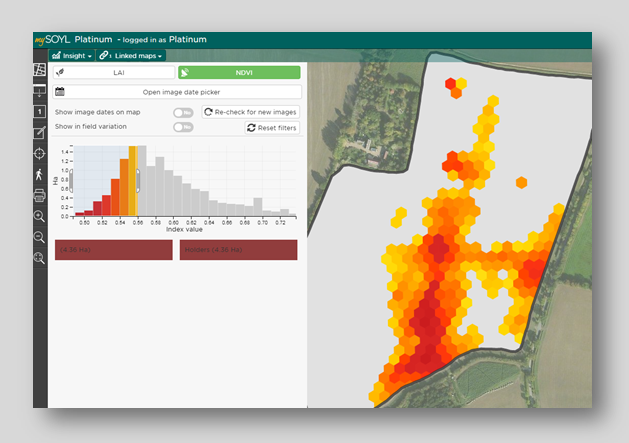
If you look at the image below, the variation in colours is showing some interesting data and the clever thing about MySOYL is that it is 'interactive'.
Firstly, there's data analysis of the variation. To the left of the map you can see a distribution graph, showing 'Variance' on the x-axis and 'Hectare' on the y-axis. It's a really useful and visual way to understand how much of the field is being affected – not just by flea beetle – but by rabbits, deer, slugs and pigeons too. I have seen a few examples where this graph suddenly makes rabbit netting look cheap!
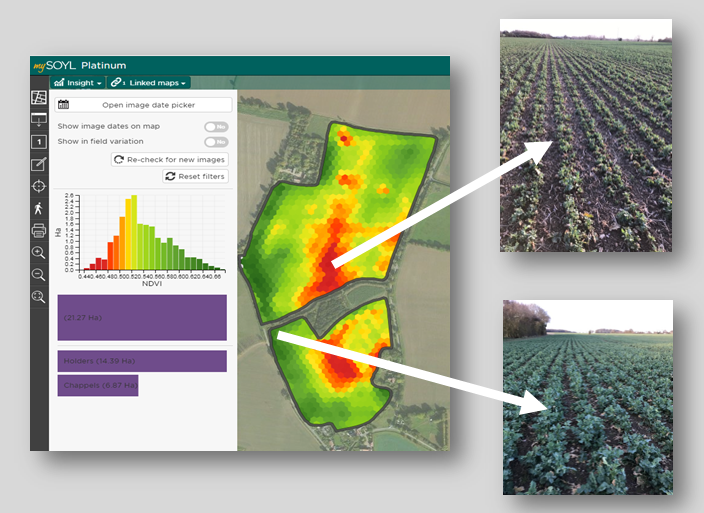
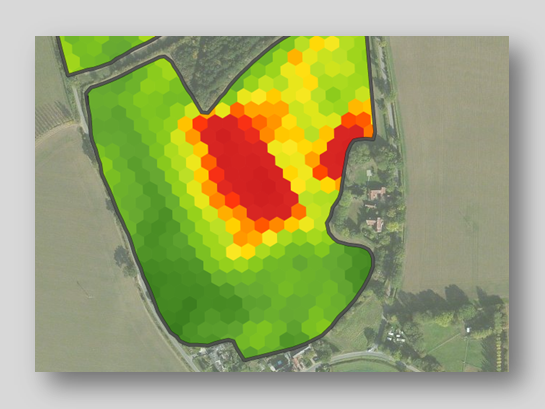
As well as analyse this data, you can also put it to practical use. By using SOYL's field scouting app, iSOYLscout, you can navigate back to set areas and record what you see. Using the 'Interrogator' tool, you can record calculations to measure the impact of pest damage on the affected area. To make this easier, the image below shows how 'good' areas can be excluded from the analysis so that the technology automatically measures a selected area on one or multiple fields.
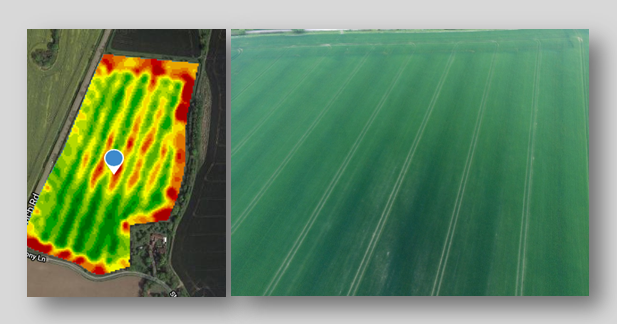
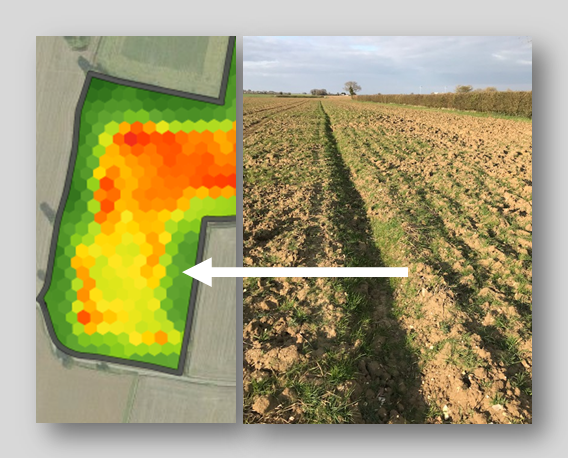
- Errors
Unfortunately, not everything always goes to plan. The images below show the aftermath of a product spill when spreading compound – we can see evidence of the affected areas between the tramlines. Proof of application errors and data to support crop claims can be gleaned from your biomass imagery and, often, this detail can become apparent well before you see it with the naked eye. This allows you to put preventative measures in place to stop it happening again.
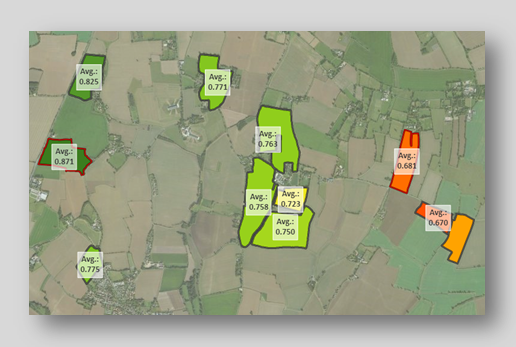
- Timing of product
While we can look at the detail of each fields' variance, sometimes we just want to compare one field with another. In MySOYL, when you zoom out to see multiple fields, the average NDVI value is listed per field and coloured accordingly.
This can be used to see how forward some fields are compared to others, helping you to prioritise growth regulators and final nitrogen doses, amongst other things.
- Drainage and compaction
Drainage and compaction can hinder root growth and therefore yield. Biomass imagery really shows this - I have seen it identify drainage schemes which have broken down and instances where headland compaction is hindering headland yield.
- Using the biomass images in the autumn
This can be a great way to assess establishment differences across the field and the data can be used to tweak variable seed rate maps later on.
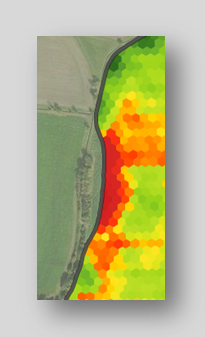
- Over winter stubble and ploughed land
If black-grass takes up residency in an area of land where there isn't a crop, satellite imagery can provide you with a black-grass map. The below example shows black-grass growing and highlights particularly bad patches on the headlands on overwintered plough.
- Taking areas out of production for environmental schemes
Biomass imagery is a great tool for helping you to decide which areas of land can be taken out of production and drilled with stewardship mixes.
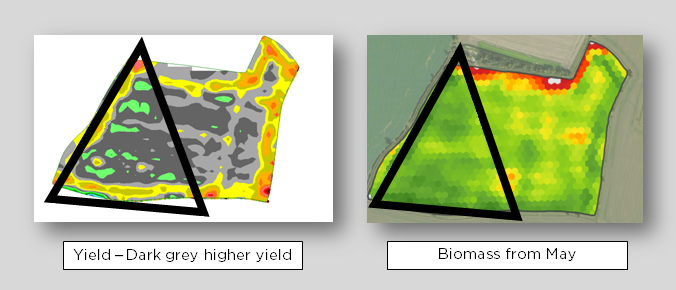
- Satellite images show a very strong correlation to yield maps later in the season
Many growers use this to vary the nitrogen on the final dose, particularly those growing milling wheat, as the insight can be used to feed the' thicker' areas in order to maintain protein. The images below show the biomass in May compared to the yield map from August. The area in the red triangle identifies the good area on both maps.
The opportunities are endless
As you can see, the range of uses for satellite imagery throughout the year is extensive. On most occasions, the variances recorded are not always visible on the ground – certainly not from the gateway – and when they are it is usually too late to take any meaningful action. With MySOYL's satellite imagery capabilities, you can regularly monitor crop progress and performance and, as a result, quantify and aid management decisions going forward in order to get the most from your inputs.
Stuart Alexander
Regional Business Development Manager

As a subscriber, you’ll receive email alerts each time a new blog is published so you can always stay updated with the latest advice and insights from our experts
Comments