- Home

- Blog
- David Whattoff
- What is the difference between multispectral & hyperspectral imagery?
What is the difference between multispectral & hyperspectral imagery?

The remote sensing of vegetation is an important tool in the SOYL toolbox, enabling farmers to quickly identify variations in crop biomass and monitor crop health. Remote sensing works because growing crops reflect light in specific wavelengths (especially near infrared) according to their growth stage and state of health. Sensors receiving these multiple bands of visible red, green and blue infrared and ultraviolet energy are called multispectral sensors.
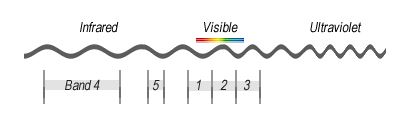
The data SOYL collects from satellite-mounted multispectral sensors typically comes from five wavelength bands along the electromagnetic spectrum (Figure 1). To turn this data into a map that's useful for growers, the data is mathematically transformed into a vegetative index. The most popular of these indexes is NDVI (normalised difference vegetative index) as it is sensitive to both variations of crop biomass and greenness and is used as the basis of our variable rate nitrogen service.
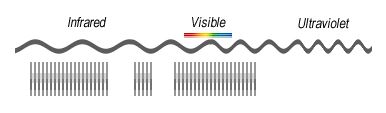
Recently, SOYL has been working with cutting-edge technology to get even more information from the remote sensing systems, such as in-crop nutrients and dry matter content. To determine these key factors, a lot more data needs to be collected from the electromagnetic spectrum. To achieve this, hyperspectral sensors have been employed to collect hundreds of narrowband wavelengths simultaneously (Figure 2).
The output from a hyperspectral sensor is called a 'data cube'. This can be thought of as a stack of hundreds of pictures with each image representing a specific wavelength. It is the data cube which represents the unique finger print or 'spectral signature' of an object, considerably improving its identification and classification.
In recent trials using a hyperspectral sensor, we were able to determine the amount of nitrogen that had been taken up by the crop (Figure 3).
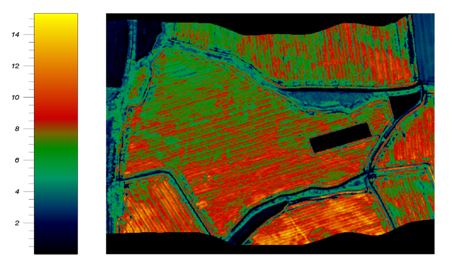
This type of hyperspectral insight is invaluable in being able to determine nutrient use efficiency and managing crop quality factors such as protein, which is impossible to measure with multispectral technology.
While hyperspectral technology is still in its infancy within the agricultural sector, multispectral remote sensing will remain a valuable, cost-effective tool for many farmers looking to manage spatial variation and crop canopies. But, in the not-too-distant future, game-changing hyperspectral imaging will be able to determine a wide spectrum of in-crop nutrient contents, dry matter values and will even be able to predict yield – possibly weeks before harvest.
David Whattoff
SOYL Agricultural Development Manager
As a subscriber, you’ll receive email alerts each time a new blog is published so you can always stay updated with the latest advice and insights from our experts
Comments