Imagine if there was a way to automatically know which areas of your production system are most profitable and those which are loss-making. Wouldn't it be great to know which management decisions had paid off, which new methods of working had or hadn't worked and if all of this information could be collected with minimum effort?
For farmers that take advantage of GPS yield mapping, this is exactly the information they have available. However, with so much insight at their fingertips, it can sometimes seem difficult to get the maximum value from the yield data. Some may find the information hard to interpret or feel that it actually raises more questions than it answers.
With this in mind, below are a few 'easy-wins' that can help to make the most of your yield maps as you review them following harvest.
Look at your yield map in two ways
You can use your yield map to show two crucial things – where yields vary or where you are more or less profitable. If you consider that your costs are fixed across a field and factor in the price of a tonne of grain, then a breakeven yield can be calculated, e.g. 9t/ha of wheat. Any areas of the yield map below this figure can be considered loss-making.
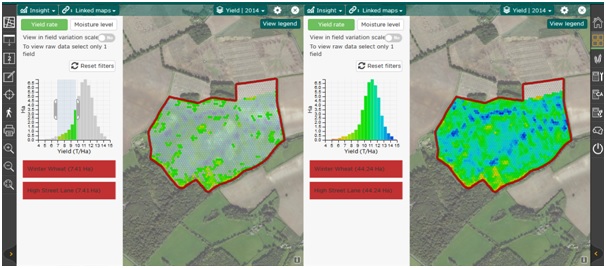
As well as knowing which areas are making a loss (and a profit), you now also know where these areas are. So, what can you do about them?
A simple step is to get out and field-walk; scout out those loss-making areas. Take soil samples and inspect soil structure on the stubble. You may find that a spot of liming is needed, or subsoiling to help remove local compaction. Similarly, if it is a particularly heavy area where slugs are problematic, additional management techniques may be justified. Later in the year, crop examination of the area can then be undertaken by you or your agronomist.
Previous seasons
A good idea is to compare your maps with previous seasons. If you can see that a poor yielding area has persisted across a number of years, it should be prioritised for investigation so that you can make efforts to stop this trend.
Yield values
Use your maps to look at the absolute yield values – not only across a single field, but between multiple fields too. If yields are noticeably different between fields, P and K offtakes will vary and this should be factored into your recommendations. For example, did higher yielding fields record lower protein values? If so, then N rates should be adjusted to deal with this difference.
On the contrary, if, for example, lower yielding areas were associated with known weed patches, these can be targeted with additional controls. Alternatively, if you are variably drilling seed, you could target appropriately to help mitigate weed pressure.
Get the most from your field
The above are just a few benefits that can be derived from yield data and, as your experience of using your yield maps grows, they can be used to support on-farm trials, variable yield goals, calculating nitrogen demand and much more.
Using a platform such as MySOYL to store and view yield maps , alongside SOYL'siSOYLScout application for field investigations, means all of the above is joined up and easy to do.
For more information about how these services could support your farm, or if you'd like more tailoered advice to help make the most of your yield data, get in touch with our team.

Simon Griffin
Technical Manager