- Home

- Blog
- Edward Jones
- Understand your farm's profitability with margin maps
Understand your farm's profitability with margin maps
I'm sure that anyone working in agriculture doesn't need me to tell them that farm finances are coming under more scrutiny now than ever before. This is particularly true this year following the effects of the wet winter and dry spring, compounded further by the impact of Covid-19.
With this increased focus, I am finding that there is a greater drive from our customers to combine some of the data routinely collected through precision farming to get a better insight into farm profitability.
In response to this demand, last year we added a 'margin map' tool to MySOYL, our precision farming management service which is available within Frontier's MyFarm platform. Margin maps provide a simple but powerful solution for growers to monitor the financial performance at different scales from the farm level, field level or even down to individual hectares.
The tool uses yield data and simple costs to produce financial performance maps that not only provide a field average, but also show the spatial variation in profitability. By including yield data and costs for multiple years, you can easily analyse financial performance across your whole rotation instead of just year by year.
How does it work and how could the tool help you?
I thought it would be useful to provide a breakdown of what it is the tool does and how you can make it work for your farm business.
Getting started
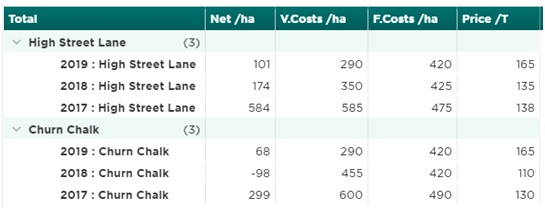
Firstly, all you need to know are three basic costs:
Variable costs – These are your seed, fertiliser, crop protection etc. costs for the field
Fixed costs – Rent, depreciation, and any fixed costs associated with growing a crop
Crop price – The price you sold your crop at.
I'm sure many of you will have a record of these costs for your individual fields but, even if you don't, there is still a lot of value in using average costs to produce the maps. For example, you may know roughly that all of your feed wheat sold for the same price and cost you the same in variable costs, so you could apply the same average costs across all of them. Similarly, your fixed costs are likely to be similar across all fields in a farm block.
While inputting these costs is a manual process at the moment, you can batch input these for groups of fields – a useful solution for the scenario I've just mentioned. Importantly, we are working hard to create connections between systems so these costs can be automatically inputted for you.
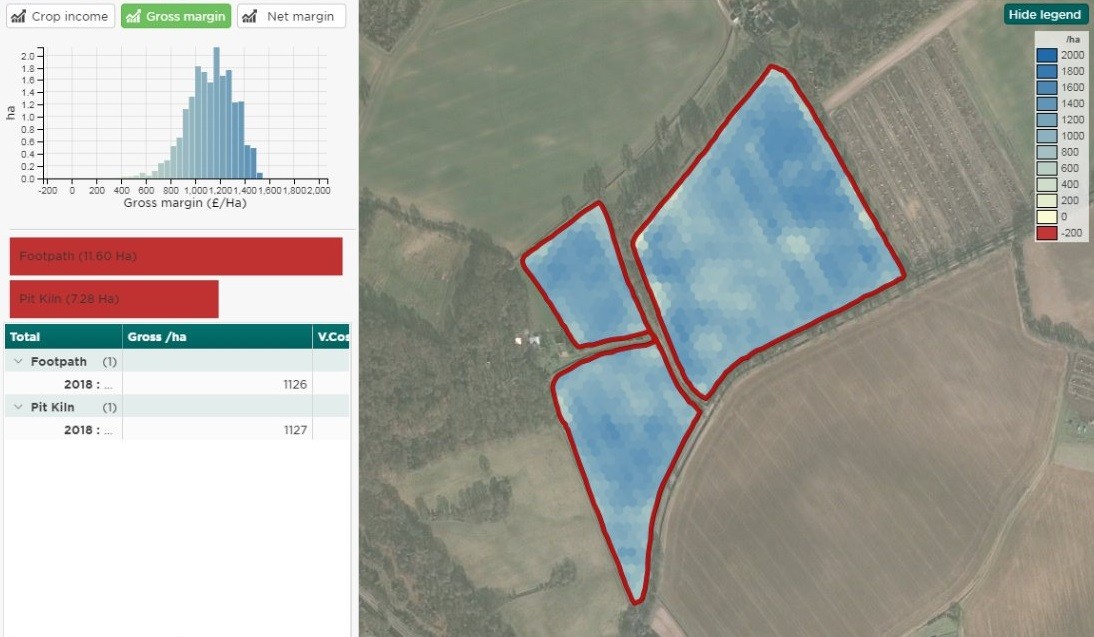
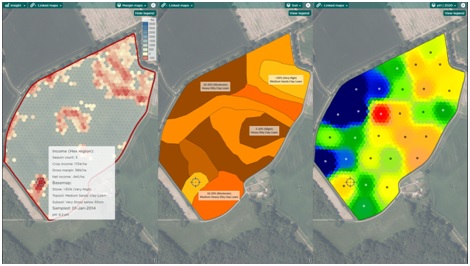
With these costs loaded into MySOYL, your data is then displayed in three maps:
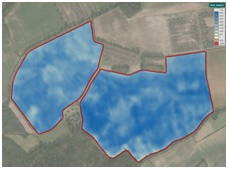
Crop income – Displaying what I refer to simplistically as your 'raw money made'. It uses the yield data and crop price for the selected years to show a cumulative total of the income from your fields before any costs are accounted for.
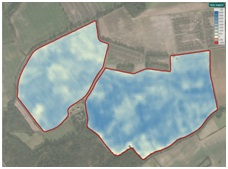
Net margin - By accounting for your variable costs, the net margin map displays your financial returns once your production costs are accounted for.
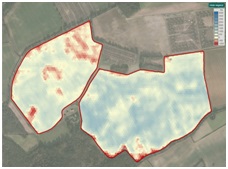
Gross margin - The output that many will probably class as the most important of the three. Accounting for both your fixed and variable costs, it displays your financial 'bottom line'.
Using this information on your farm
Once you know what it is you are looking at, you need to know how best to interpret the information so that you can use it to help your business to become more profitable and resilient.
To better explain this, below are three examples from some of our customers, all of which show how you can put the data to good use.
Environmental schemes
Whether you are already in an agri-environment scheme, planning a new Countryside Stewardship (CS) agreement; looking to make best use of Ecological Focus Area (EFA) requirements or preparing in readiness for the Environmental Land Management (ELM) scheme, choosing where to site your options or compliance features is an important decision.
By using the gross margin map tool, you can quickly identify the least financially viable cropped areas of your farm which may suit an environmental scheme, thus guaranteeing a regular income from land areas that may not have otherwise been productive.
Once you know their placement, you can use the technology within MySOYL to determine the nutrient and soil types of these areas, helping you to make informed decisions about their management. For help with choosing the best stewardship options and subsequent seed mixtures, our colleagues at Kings Crops are more than happy to assist too – working with you to ensure any crop mixtures suit your wider rotation and circumstances.
Contract farming
Many of the growers I speak to are engaged in contract farming agreements and can sometimes struggle to justify expenditure or improvement works to landowners. A net margin map may better demonstrate the need for any development work on farm and can support discussions around any associated costs.
When it comes to extending agreements or annual reviews, with a gross margin map contractors and tenants can demonstrate their success by highlighting the positive financial returns of their farming practices and choices.
Rotations and variety choices
Deciding on the best break crop within your rotation can be a difficult decision but by having a gross margin map to hand, you can view and assess the impact across your whole rotation.
When choosing a variety, it can be all too easy to opt for the highest yielding based on yield maps but with a crop income map, you can account for the difference in selling price due to potential differences in end markets.
Learn more about the margin mapping tool, available in MySOYL
For a more detailed explanation of how the tool works, watch the short tutorial below to see it in action.
If you have any questions about how to better understand the financial performance of your fields with MySOYL, please speak to your local SOYL contact or get in touch.

Edward Jones
MySOYL Business Lead


As a subscriber, you’ll receive email alerts each time a new blog is published so you can always stay updated with the latest advice and insights from our experts
Comments