- Home

- Blog
- Simon Griffin
- Field grain analysis results
Field grain analysis results
Earlier this year my colleague, Ed Downing wrote a blog about our field grain analysis service and how it provides full-scale insight into your crops' nutrients and performance as well as highlighting actionable next steps for future seasons. In that blog Ed referred to the volatility of the fertiliser market and as I write, it is just as buoyant now. With nitrogen fertiliser prices around £700-800/t or more than £2/kg, applying the optimum amount has never been more important.
Every kilogram of nitrogen that isn't taken up by the crop is left unused, with the potential to leach away over winter which can have a huge impact on the farm's bottom line. You might adjust the rates and times of applications, use new products, inhibitors and additives, or invest in state-of-the-art technologies to help with fertiliser management - all with the intention to improve profitability. But, how do we know these have worked? How do we know if it was more than just an interesting idea? What was the payback?
Field grain analysis in action
Luckily there is a relatively simple answer to the questions above. As we've mentioned before, the only real way to measure the effect of nitrogen is at the end of the season when we have the opportunity to analyse grain on an individual-field basis. From this, the findings can highlight the specific adjustments needed for the following season.
Frontier and SOYL Precision's field grain analysis service gives interpretation over all the essential nutrients to make sure you as a grower get the most from your data. In this blog, I'll focus on the nitrogen analysis results from this year's sampling.
The results
We collated results from over 400 fields that consisted of milling and feed wheat and the initial findings show some interesting trends.
Feed wheat
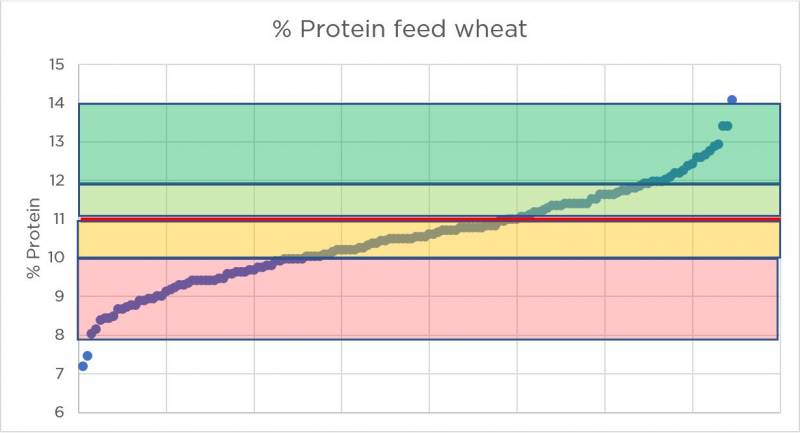
The nitrogen management is considered optimised when grain N % measured as protein is at 11% for feed wheat. The results in the chart below show a huge range from 7-16%, with an average protein of 10.5% which is 0.5% below optimum.
Taking a closer look 63% of fields were below optimum protein, with 27% of fields more than 1% below optimum (shaded red) and 16% more than 1% above (shaded green). These fields could potentially have adjusted fertiliser rates to use N more efficiently.
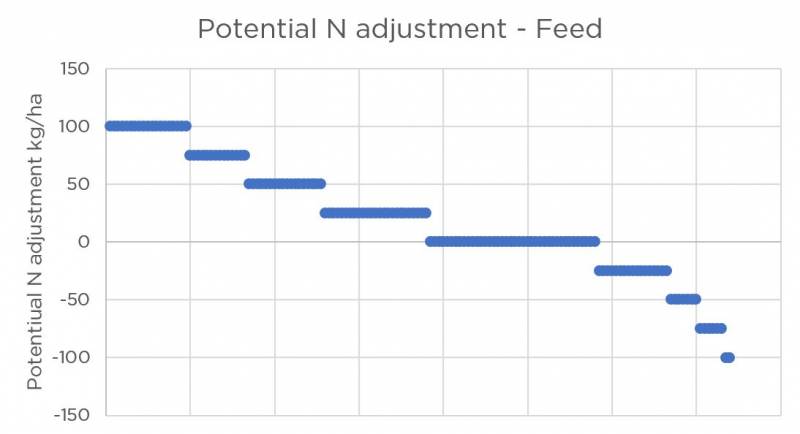
A noticeable trend is that the average protein for this season was almost 0.5% less than last season. Possible reasons for this could be higher yields achieved which caused dilution or lower N rates applied. However, this reduction gives scope to adjust N rates. The AHDB Nutrient Management Guide (RB209) recommends growers think about a 25kg increase or decrease for every 0.5 % away from the optimum.
From the graph below, you can see many growers could consider increasing N rates to optimise for protein and yield.
Absolute N rates
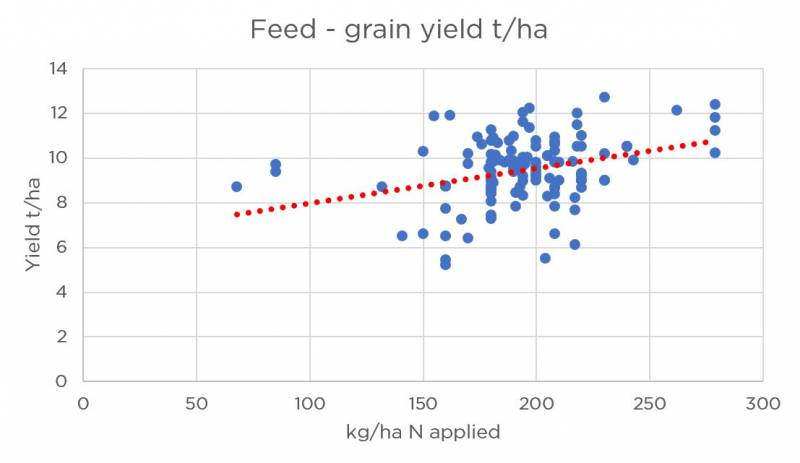
There was a considerable correlation between nitrogen applied and yield in the feed wheat results. For this year's set of grain data, the application of over 230kg/ha of nitrogen guaranteed a 10t/ha yield. However, some high yields were also achieved with lower rates. You can see these results in the diagram below.
Milling wheat
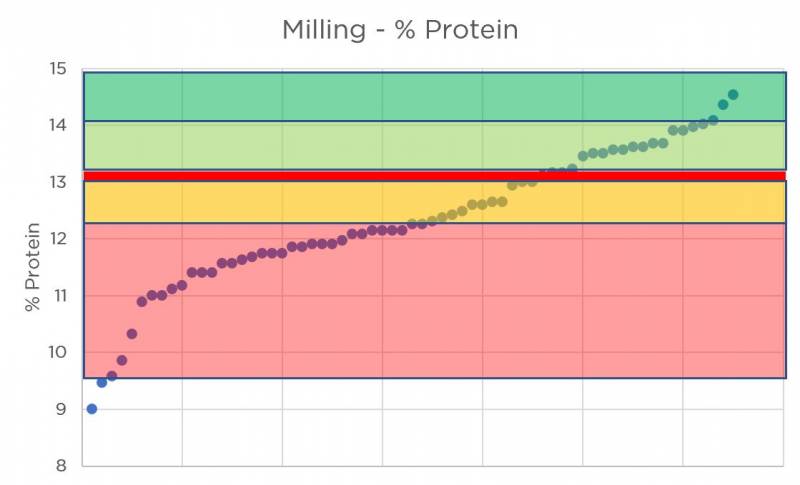
Milling wheat, with a target of 12.5 or 13% protein, showed a similar pattern to feed wheat and had a range of 9-15%.
From the graph below you can see that 67% of fields were below optimum and 28% of fields were more than 1% below optimum (shaded red). Meanwhile, 15% of fields were more than 1% above optimum (shaded green).
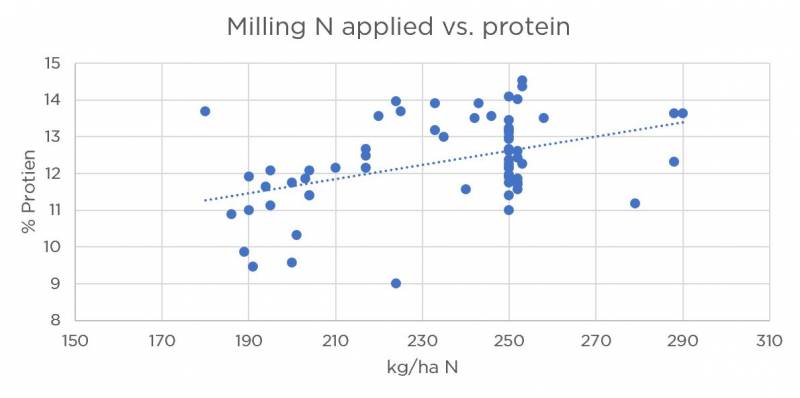
With regards to absolute N rates, data showed that if nitrogen was applied below 220kg/ha there was a very low probability that 13% protein would be achieved. With applications between 220-250kg/ha N, there was a more even chance. With applications over 250kg/ha of N, there was a high probability 13% would be achieved.
Nitrogen use efficiency
Nitrogen use efficiency (NUE) is the percentage of applied nitrogen that is taken up by the crop. For every 100kg N applied to a crop, the goal is to ensure as much of it is utilized as possible. This reduces waste and is both economically and environmentally beneficial.
NUE uses grain nitrogen and yield to calculate offtake. Although we do not include N supplied by the soil in this measurement, we can see a wide range of NUE for measured fields in the graph below. Some N is used efficiently, while on other fields NUE is poor.
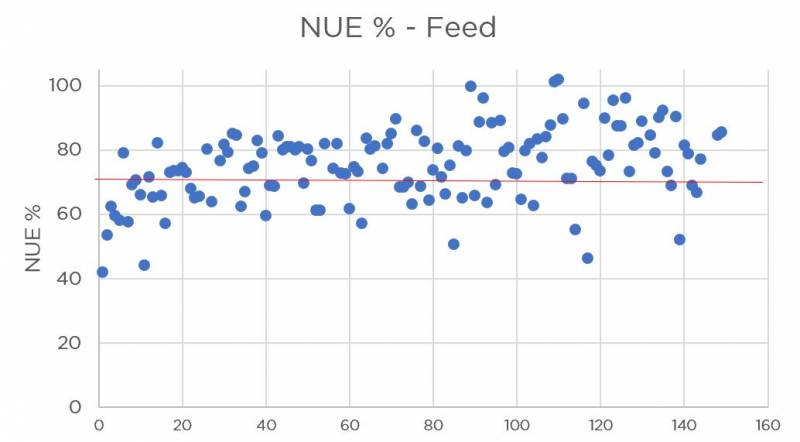
If you haven't already taken steps to optimise nitrogen use, you can measure the NUE of the fields on your farm and target those which score below 70% as a starting point. Management related to improving NUE could be changing N rates, altering the timings of applications, improving soil management, opting for more appropriate varieties and using precision services such as variable rate technology.
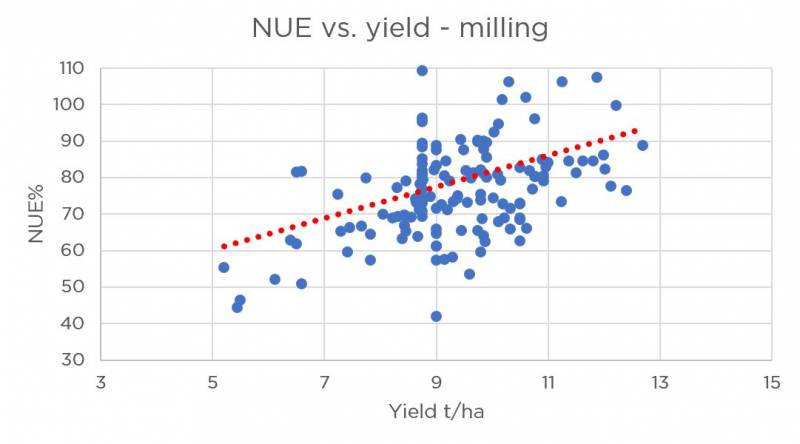
Another interesting selection of data compared yields with NUE. The findings suggest that improving NUE is key to optimising yield and in turn illustrates the importance of using nitrogen more efficiently.
Summary
The high cost of applying nitrogen is a reality over which none of us have control. However, you can control how you apply nitrogen to your fields.
Given the current market, you may be starting to consider different approaches. While there are a lot of interesting ideas out there, many rely on a finger in the air or gut feeling to decide if they are ultimately beneficial.
In comparison field grain analysis gives you instant feedback, immediately confirming the success of your nitrogen strategy. You can see this firsthand in the results above. Field grain analysis not only gives you raw results, but with the help of some interpretation, it tells you if you should consider increasing or decreasing your nitrogen rates too. A nitrogen use efficiency score also lets you know just how much of your purchased product contributes to crop yield and quality and how much is at risk of being wasted.
The key is to keep sampling – you want to build up a picture over a number of years. Nitrogen rates can then be targeted to specific fields and varieties, taking the guesswork out of your nitrogen strategy by ensuring you optimise inputs and thereby increase profitability.
If you have any questions about the results outlined in this blog or would like to learn more about our field grain analysis service please speak with your local Frontier contact or visit the SOYL website. Alternatively, you can get in touch.

Simon Griffin
SOYL Technical Manager


As a subscriber, you’ll receive email alerts each time a new blog is published so you can always stay updated with the latest advice and insights from our experts
Comments