Optimising nitrogen inputs: measuring residual N with satellite imagery
I'll admit that at first sight filling your tractor with oil and planning your nitrogen applications don't appear to have much in common but in one simple way they are very similar. Before you do both, you need to know how much you've already got in the tank or in the soil, so you know exactly how much more you need to put in.
When it comes to nitrogen applications, rates should only be decided once you have fully assessed the requirements of your crops. As well as thinking about inputs, this also means making an informed judgement on how much nitrogen will be supplied by your soils.
What contributes to the amount of soil nitrogen?
The level of nitrogen that is available in the soil depends on a number of factors. Soil type and organic matter can have an impact but they are quite stable soil components, whereas things such as rainfall, temperature, previous crops and yields can be more variable, and therefore make significant differences from season to season.
As a result, residual nitrogen is a key consideration when planning applications. It refers to the amount of nitrogen left behind, or 'carried over', after a crop has been harvested plus freshly mineralised nitrogen produced from the breakdown of soil organic matter.
What alters the amount of residual nitrogen in the soil?
The management and performance of a crop can have a significant effect on the amount of residual nitrogen that is left in the soil after it has been harvested.
Residues are likely to be small if the amount of nitrogen applied during crop growth was a good match to what the crop required. If the supply suited the demand then it will have been used efficiently (a good Nitrogen Use Efficiency, NUE) and there will be a smaller amount left unutilised.
On the other hand, residues may be larger if the harvested crop produced smaller yields than expected as a result of disease, weeds or drought, for example. If the crop simply wasn't capable of taking up the nitrogen that was there, more will have been left in the ground after harvest.
What was the effect of the 19/20 season on residual nitrogen levels?
There were numerous factors in this past season that impacted residual nitrogen levels.
Over the winter, very high levels of rainfall meant that a lot of the normal nitrogen reserves were leached from the soil. In stark contrast, the spring weather that followed was very dry and this potentially had an impact on levels of nitrogen uptake. Fertiliser nitrogen needs to be taken up by the plant in solution and rainfall is required to facilitate this. Therefore, in areas where there was no rain before grain development, some of the nitrogen was potentially left in the soil, unused by the crop.
After what was a very challenging season many crops achieved lower than average yields and, in situations where 'normal' levels of fertiliser had been applied, some product was left over because it was not taken up by the crop. Although in some areas where crops performed very well, lower levels than normal would have remained.
Similarly, the increased use of cover crops this past year has also changed the amount of nitrogen that is preserved in the soil. These crops can conserve the nutrient, storing it for potential release to the following crop when it is destroyed.
Taking all of the above into account, and depending on a farm's specific situation, rotation and management practices, it's very likely that many growers will have experienced an increase or decrease in residual nitrogen levels compared to 'normal'. The question is: How can you find out what they are in order to make an informed decision about applications going forward?
In an ideal world to answer this question you would assess the N off-take of your previous crop while also quantifying how much is left in your soil. By taking this combined approach you can be sure you know exactly "how much is in the tank".
Assessing residual nitrogen levels with satellite imagery
Predominantly, residual nitrogen is measured by carrying out soil analysis which does provide highly accurate results and a good insight but, depending on the breadth and detail required, can be a costly exercise for some.
An alternative method for monitoring levels is satellite imagery, and this can be a great way to investigate how and where it varies from field to field too.
When viewing blocks of fields with the same or similar drilling dates, say all those drilled in the second week of September, any crop growth that has taken place before the first application of nitrogen in the spring can be directly attributed to whatever nitrogen was available in the soil.
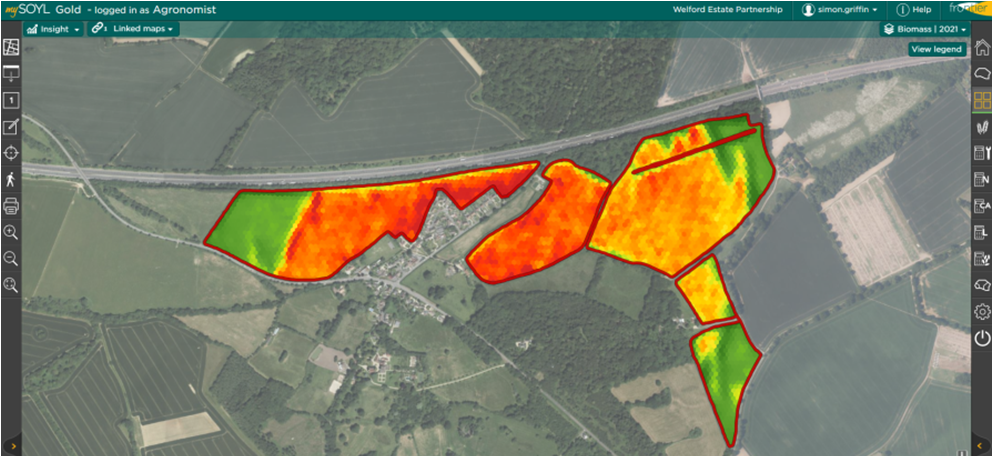
You will see from the above image - a block of wheat in November - that crop growth varies significantly, both between and within fields, and this variation will be heavily influenced by soil available nitrogen. Those areas which have seen more crop growth (green) are likely to have had more nitrogen available within the soil than those areas where growth is lower (red).
What steps can you take to optimise your nitrogen availability?
Although a higher level of residual nitrogen will aid with crop growth in the autumn, the very fact that it's high means that it potentially wasn't used efficiently by the previous crop. Likewise, if levels are low you should look to re-dress the balance and may subsequently choose to apply more nitrogen to affected areas in the spring.
The aim with nitrogen management is to always optimise use– matching inputs to crop requirements so that it is used as efficiently as possible meaning the minimum is used to produce the economic optimum yield.
To ensure optimum nitrogen applications that meet crop demand, it's a good idea to measure levels with satellite imagery in the autumn and then again in early spring. If you notice any differences, you can proactively respond by adjusting rates in each field or by applying nitrogen variably to help target specific areas.
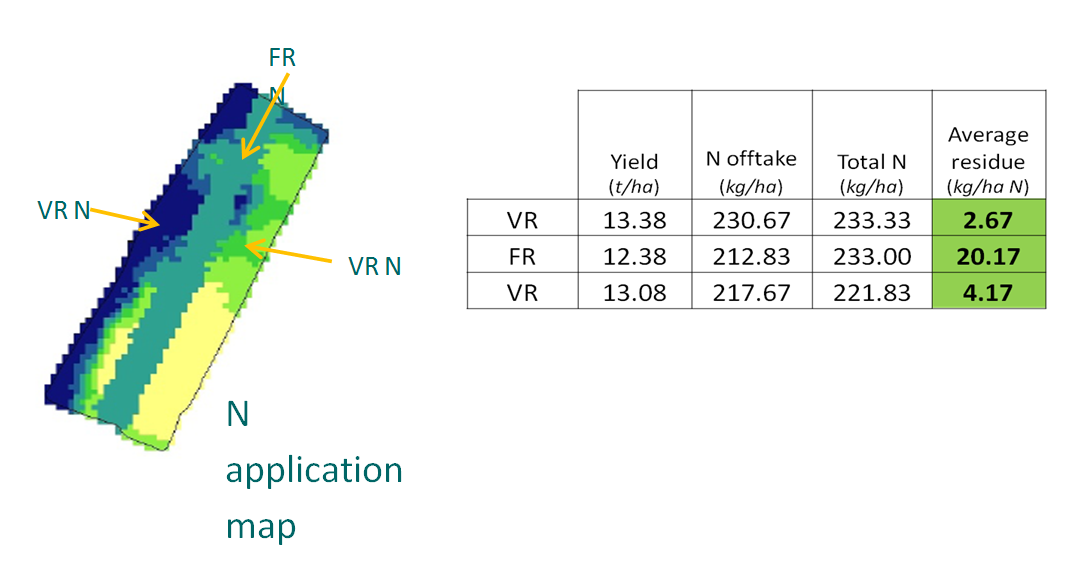
In trials work carried out by SOYL, it has been shown that where inputs are matched to crop biomass, overall nitrogen uptake is maximised. As a result, any residual nitrogen – or unutilised excess – is reduced. With the insight from satellite imagery giving you a way of monitoring levels each season, you can always ensure the need of each following crop is met more precisely, optimising inputs and ensuring the cost-effective use of any product.
If you would like more information or guidance on any of the above, please speak to your local SOYL contact or get in touch with our team. To learn more about variable rate nitrogen applications, visit our website.
As a subscriber, you’ll receive email alerts each time a new blog is published so you can always stay updated with the latest advice and insights from our experts


Comments